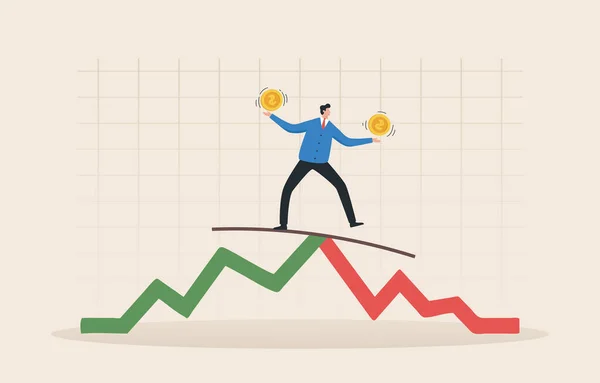
Sideway Trend Market Conditions Unstable Volatile Price Chart Direction Travel — Φωτογραφία Αρχείου

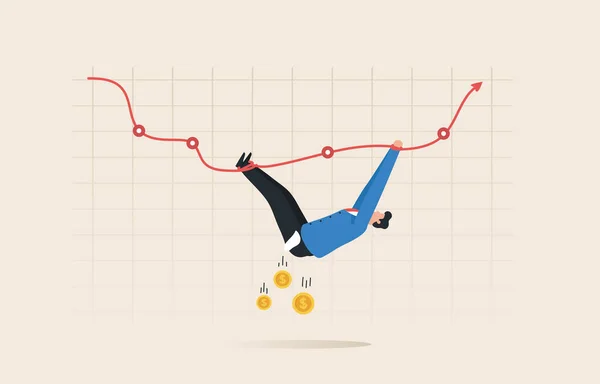
Sideway Trend, Market conditions are unstable and volatile. Price chart direction. Travel in an adjustable pattern to the side, up and down in the frame. — Εικονογράφηση

Sideway Trend, Market conditions are unstable and volatile. Price chart direction. Travel in an adjustable pattern to the side, up and down in the frame.

 — Εικονογράφηση από yellow_man

Ίδια Σειρά:

Stock market panic sell Investors sell all assets. financial crisis concept stock market graphs and charts. Businessman looking down arrow to a chair or desk.
Stock Market Panic Sell Investors Sell All Assets Financial Crisis — Φωτογραφία Αρχείου
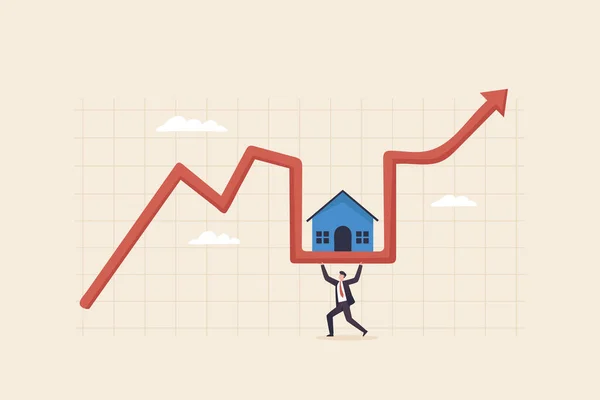
Real estate housing market bubble inflation. Red arrow on chart graph showing increase of price of houses. Businessman support house price chart.
Real Estate Housing Market Bubble Inflation Red Arrow Chart Graph — Φωτογραφία Αρχείου
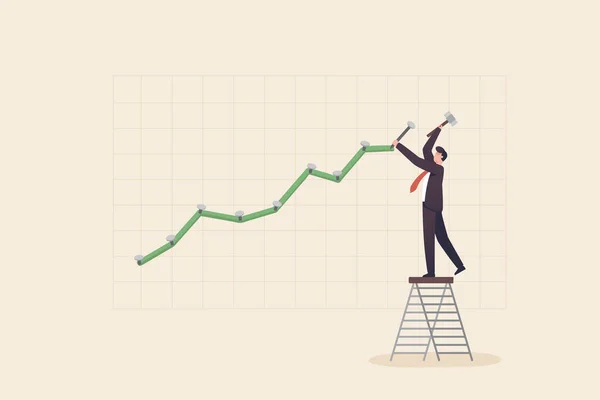
Adjustments, Modifying investment portfolio from stock market crash,making bullish run concept.
Adjustments Modifying Investment Portfolio Stock Market Crash Making Bullish Run — Φωτογραφία Αρχείου
Market volatility, business risk. investment risk price uncertainty. Digital asset risk and financial instability. Businessman walking on arrow chart with price risk and profit.
Market Volatility Business Risk Investment Risk Price Uncertainty Digital Asset — Φωτογραφία Αρχείου
Businessman stuck on danger on arrow graph holding with one hand feeling insecure. financial investment volatility uncertainty or changes in business and the stock market due to risks.
Businessman Stuck Danger Arrow Graph Holding One Hand Feeling Insecure — Φωτογραφία Αρχείου
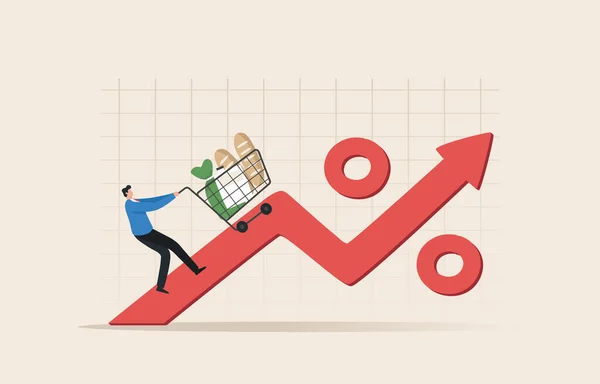
Food inflation. The effect of the inflation rate on prices. Consumer price index or CPI. Prices of commodities and consumer goods rose due to rising inflation.
Food Inflation Effect Inflation Rate Prices Consumer Price Index Cpi — Φωτογραφία Αρχείου
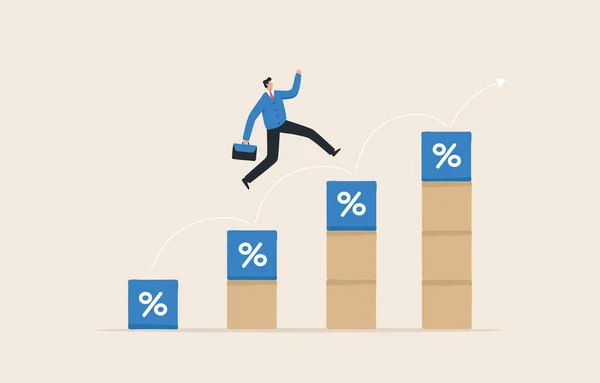
Grow business increase, a percentage increase or capital profit, growth in a job or corporate company, company profit. Successful businessmen walk up to the highest graph.
Grow Business Increase Percentage Increase Capital Profit Growth Job Corporate — Φωτογραφία Αρχείου
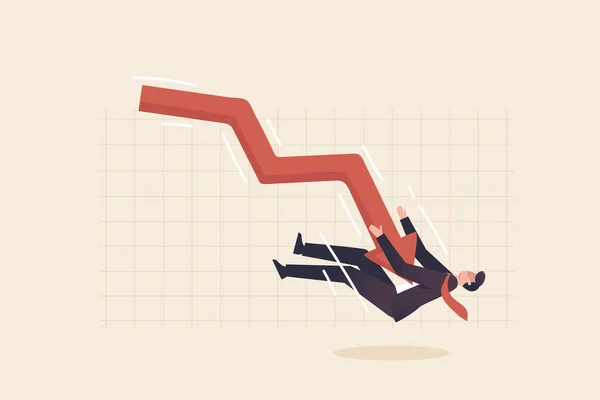
Financial Volatility, financial crisis, stock market. Falling Red Arrow Chart. The business man was wrapped his body tightly by the red arrow that fall down from the chart of stock market.
Financial Volatility Financial Crisis Stock Market Falling Red Arrow Chart — Φωτογραφία Αρχείου
Inverted yield curve. Inflation, recession, government bond yields.
Inverted Yield Curve Inflation Recession Government Bond Yields — Φωτογραφία Αρχείου
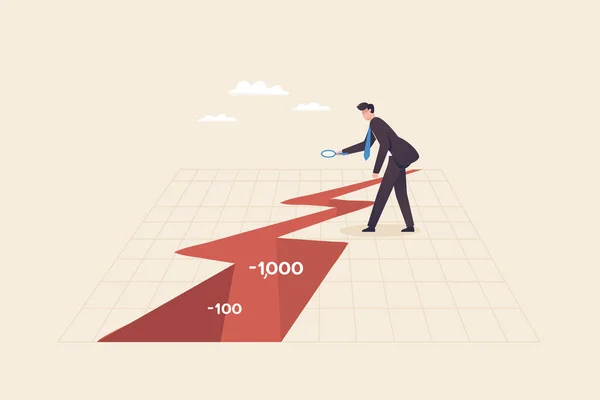
Financial volatility data analysis, financial crisis, money loss, risk assessment. Businessman holding a magnifying glass looks at a chart showing the volatile stock market.
Financial Volatility Data Analysis Financial Crisis Money Loss Risk Assessment — Φωτογραφία Αρχείου
Financial stock market volatility rising and falling concept. stock market risk or crypto currency market.
Financial Stock Market Volatility Rising Falling Concept Stock Market Risk — Φωτογραφία Αρχείου
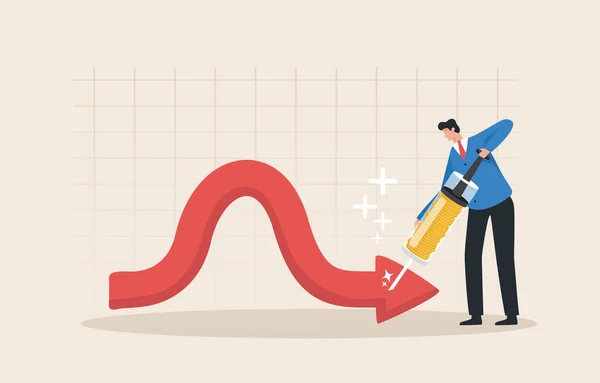
Bear market, Capital increase or investment. Strategic buying in a down market to do in an uptrend. Investors injected money into the arrow chart through a syringe.
Bear Market Capital Increase Investment Strategic Buying Market Uptrend Investors — Φωτογραφία Αρχείου
Arrow chart attacks a businessman or investor. Investment Risk, Stock market plunge, cryptocurrency or forex trading price decline, bear market concept.
Arrow Chart Attacks Businessman Investor Investment Risk Stock Market Plunge — Φωτογραφία Αρχείου
The stock market or crypto-currency is in decline. economic crisis or investment risk The concept of volatility. A businessman tries to climb the chart back to the top of the profit point.
Stock Market Crypto Currency Decline Economic Crisis Investment Risk Concept — Φωτογραφία Αρχείου
Financial guru or expert. Investment profit growth, financial advisor or wealth management.
Financial Guru Expert Investment Profit Growth Financial Advisor Wealth Management — Φωτογραφία Αρχείου
Stock market volatility, business investors fall into uncertainty, hesitation in trading in a crisis.
Stock Market Volatility Business Investors Fall Uncertainty Hesitation Trading Crisis — Φωτογραφία Αρχείου

Πληροφορίες Χρήσης

Μπορείτε να χρησιμοποιήσετε αυτή τη royalty-free εικονογράφηση "Sideway Trend, Market conditions are unstable and volatile. Price chart direction. Travel in an adjustable pattern to the side, up and down in the frame." για προσωπικούς και εμπορικούς σκοπούς σύμφωνα με την Τυπική ή την Εκτεταμένη Άδεια. Η Τυπική Άδεια καλύπτει τις περισσότερες περιπτώσεις χρήσης. Συμπεριλαμβάνονται διαφημίσεις, σχέδια διεπαφής χρήστη και συσκευασία προϊόντων, και επιτρέπονται έως και 500.000 έντυπα αντίγραφα. Η Εκτεταμένη Άδεια καλύπτει όλες τις περιπτώσεις χρήσης βάσει της Τυπικής Άδειας με απεριόριστα δικαιώματα εκτύπωσης και σας επιτρέπει να χρησιμοποιείτε τις ληφθείσες εικονογραφήσεις σε εμπορεύματα, για μεταπώληση προϊόντων ή δωρεάν διανομή.

Μπορείτε να αγοράσετε αυτήν την εικονογράφηση και να την κατεβάσετε σε υψηλή ανάλυση έως και 6945x4445. Ημερομηνία μεταφόρτωσης: 6 Σεπ 2022